All-Inclusive Software. Robust Features.

Report Templates

More than 60 reports available, catering to 10 industry use cases.
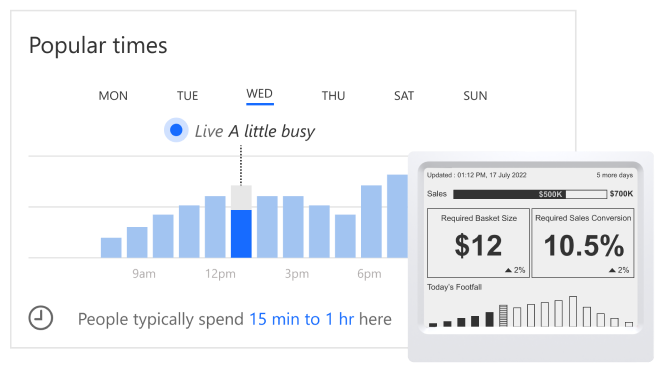
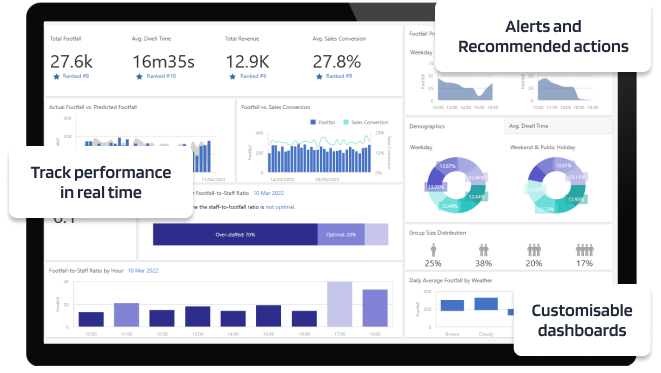
Custom Dashboards

Build your dashboard with your preferred metrics and data views.

Unlimited Users

No extra cost for user access within the same enterprise.
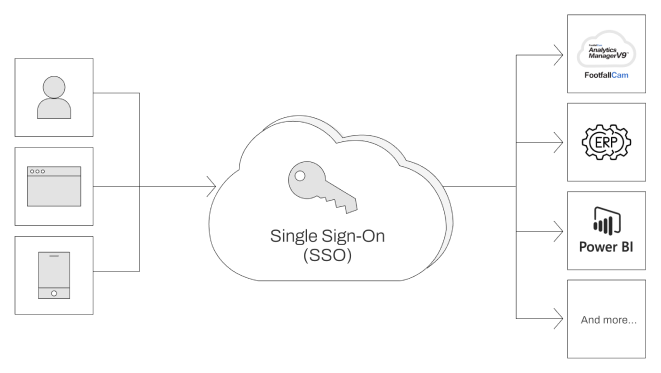
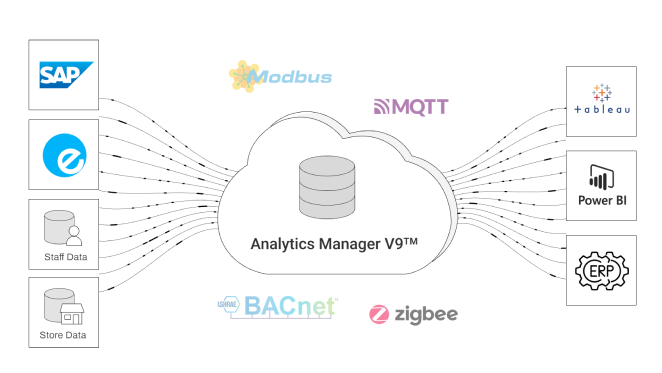
Integrate Systems

Works with your existing BI and other third party systems.

Daily Footfall Trend

The most basic and essential data metrics for businesses:

  • “How many people visited my premise today?”
  • “How is this week’s traffic performance compared to last week?”
  • “Is the footfall pattern similar to last year’s trend?”

Identify the Peak Hours

Identifying peak and off-peak footfall patterns helps business owners and managers make actionable decisions based on traffic insights,

  • Staff allocation
  • Marketing event planning
  • Operation optimisation based on predictions

Visitor Journey

Analyse the user journey upon visiting your premises, utilising heatmaps and area polygons to identify the most and least popular areas. This includes:

  • Identifying the most and least popular items based on engagement rate
  • Optimising merchandise placement
  • Making promotional planning decisions

Predictive Analytics

AI predictive modeling utilises historical traffic data and other datasets (sales, store, staff, weather, demographics, etc.) to accurately forecast future data patterns and trends, enabling better planning.

Live Data Monitoring

Provide real-time data insights, empowering businesses to take immediate actions based on footfall trends and configurable business rules. This includes:

  • Instant notifications and alerts
  • Action logs for tracking and review
  • Ensuring SLA compliance and enhancing operational efficiency.

Enterprise SSO

Seamlessly access multiple systems, including V9 Cloud, with a single login. V9 Cloud supports SSO integration and Active Directory, enabling seamless user authentication and access management across platforms.

BI System Integration

V9 Cloud integrates footfall data into customers’ BI systems such as Tableau, PowerBI, and ERP systems, providing comprehensive visibility and streamlining integration management for centralised data viewing through a single platform.

FAQs

We have over 60 readily available reports for many different metrics and job roles.

Yes, we have two types of reports, please see below.

1. Store level report – provides counting data from all entrances/devices in a single store.
2. Company level report – combines data from all entrances/devices across all branches, providing a consolidated overview of the footfall data.
 
Can the reports scheduled on daily basis?
The report can be generated on daily and weekly basis according to the schedule that will be manually configured by the user.

The report can be generated on daily and weekly basis according to the schedule that will be manually configured by the user.

Our software will support multiple counters and the counts from different counters can be combined in our web-based reporting software. You can combine the counts of the 2 counters and view the total traffic IN and OUT or you can view the total IN and OUT individually.

The data is stored and in our FootfallCam Analytics Manager, our web-based control panel. We do have an API export function which allows for you to integrate with a third-party software and pull the data from our server.

Click here for more information regarding on Export Data.

Explore options that would fit your budgets